

Downloads
Brief
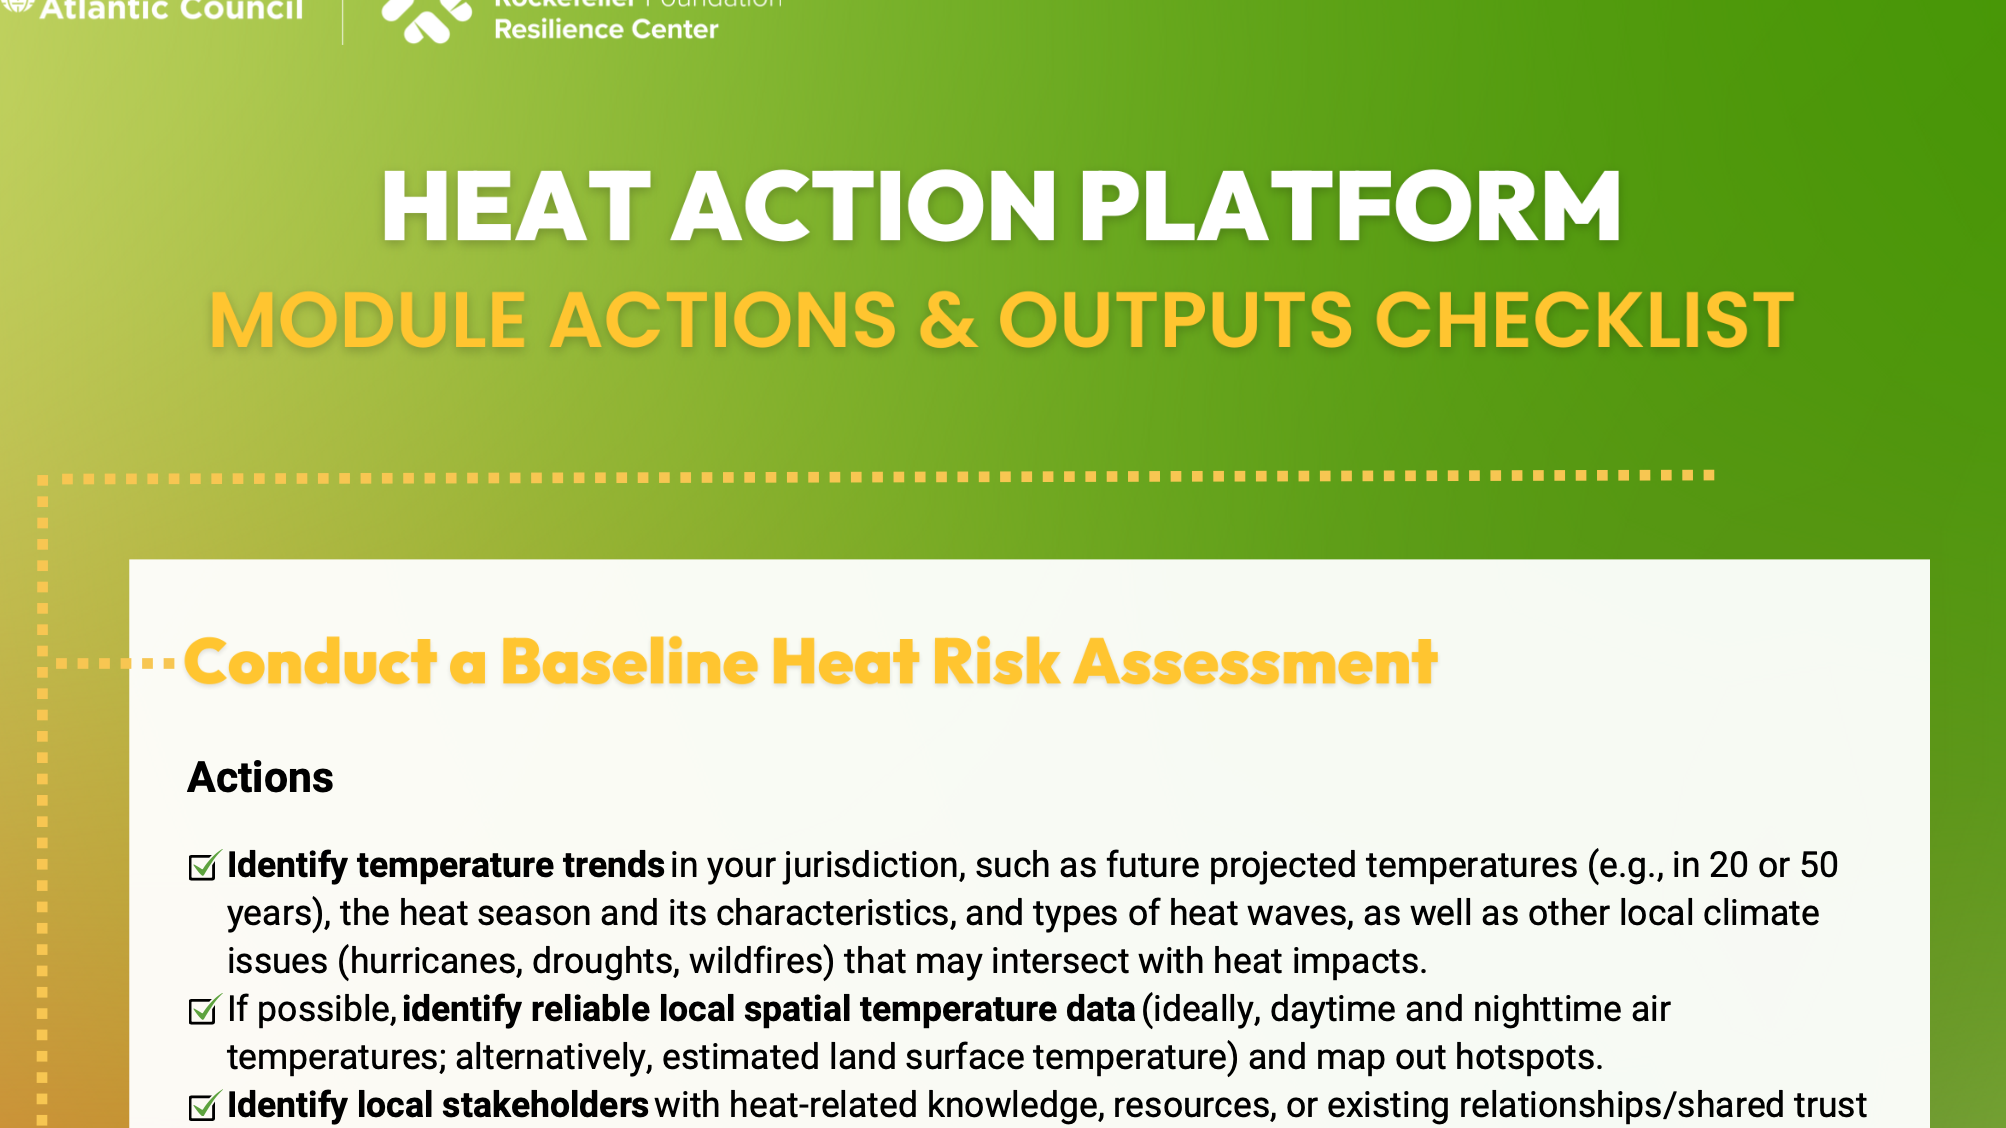
Heat Action Platform Module Actions & Outputs Checklist
This checklist combines the actions and outputs from each Heat Action Platform module into one document for ease of use.
Brief
The Arsht-Rock Compendium of Heat Risk, Adaptation and Mitigation Research
A collection of contextualized extreme heat statistics from 80+ sources spanning economic, health and environmental impacts, extreme heat solutions and governance, and more
Brief
Heat Action Baseline Conditions Assessment
This document contains a series of checklists and questions to guide research into your municipality’s heat vulnerability, planning stage, and political, social, and technical readiness for heat action.
Brief
Workers’ Protection Policies Overview
This document is a practical resource on policies that protect outdoor and indoor workers from extreme heat.
Brief
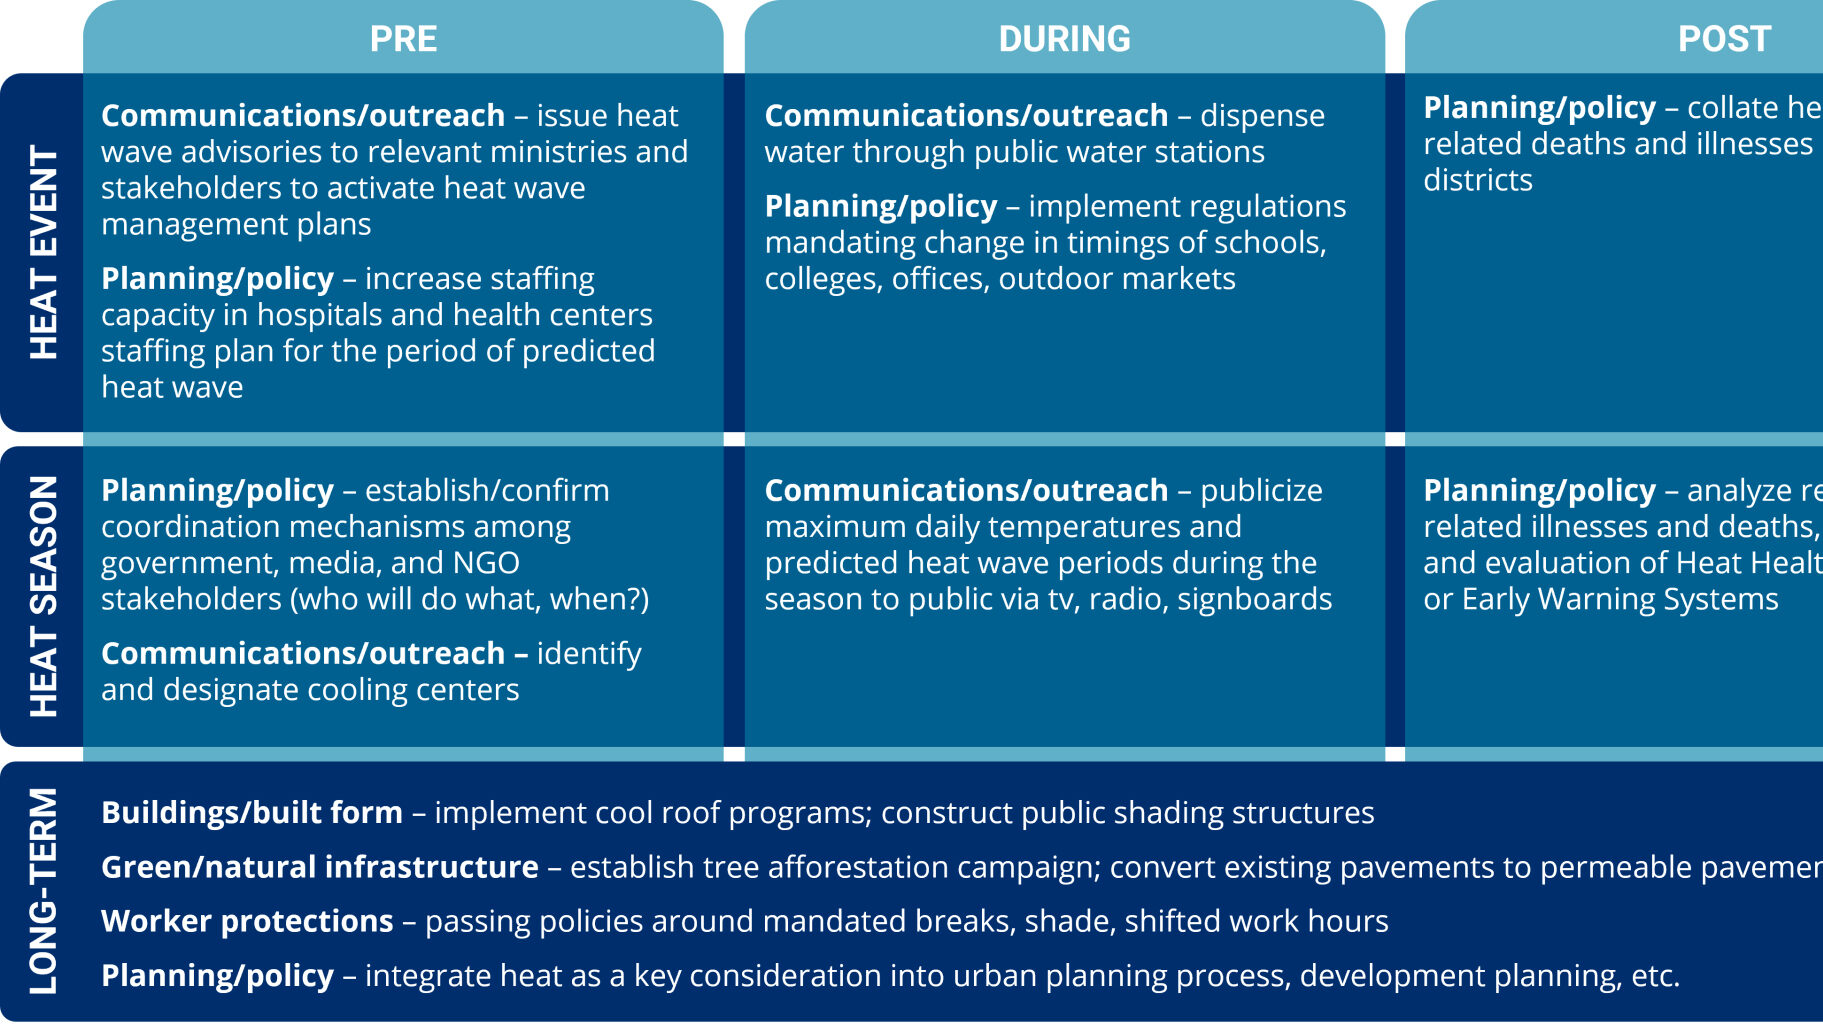
Heatwave Management Timeline
A timeline showing examples of action to take before, during, and after heat events and heat season.
Infographic
Conducting a Heat Awareness Survey
Infographic showing the process of developing a survey.

Infographic
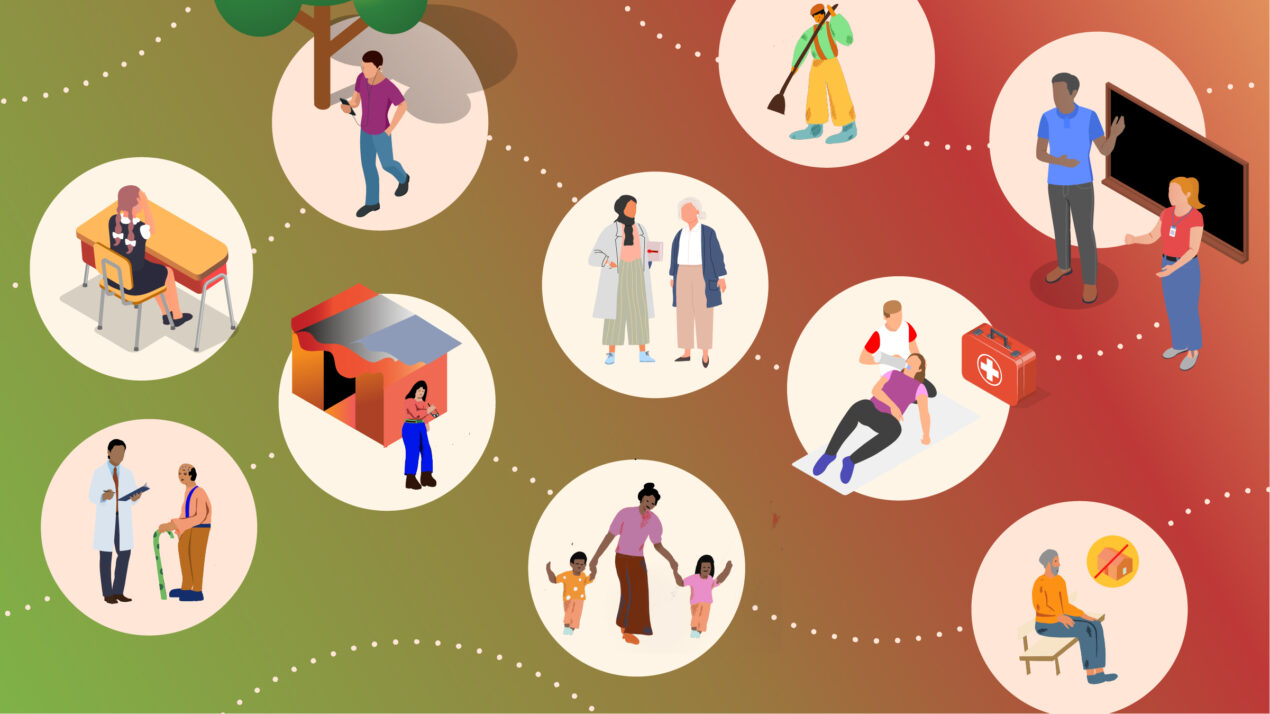
Identifying Heat Vulnerable Communities
Infographic showing heat-vulnerable populations and example of vulnerability assessment map output.

Infographic
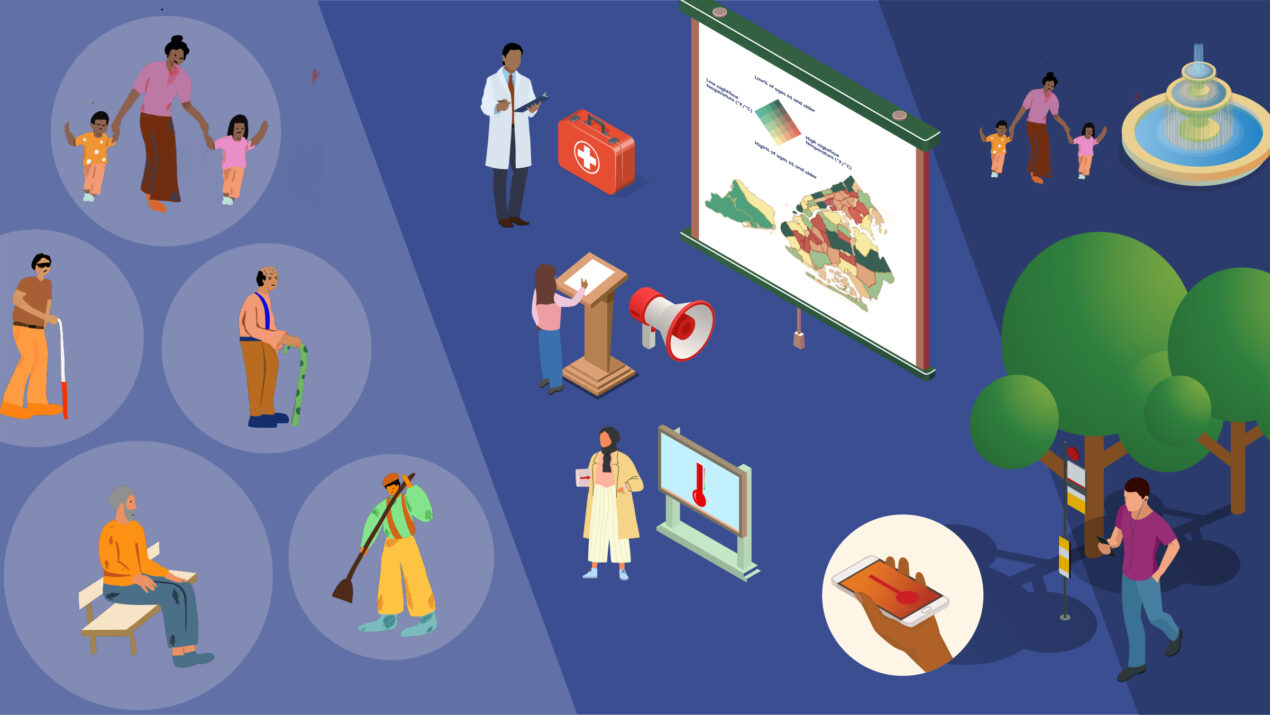
Raising Awareness About Heat Impacts and Response
Infographic about campaigns.

Infographic
Measure and Analyze Heat in your City
Infographic about heat measurement methods
Infographic
Steps to Create a Heat Action Plan
Infographic showing six steps toward creating a plan.

Infographic
Heat Resilience Solutions
Infographic depicting short- and long-term solutions

Infographic
Heat Resilience Project Metrics
Infographic about tracking key performance indicators.
Infographic
The Impacts of Urban Heat
Infographic depicting the impacts of urban heat